
The question on everyone’s mind, is the RV market tanking? Or is it simply shifting gears?
Leaning on Josh the RV Nerd and the latest data from leading sources, we will break down what’s happening across new & used RV sales, inventory, consumer behavior, and external factors like fuel and public-land access.
Whether you’re a buyer or an owner, you’ll want to understand what’s happening in the RV market!
Market Snapshot: Sales & Inventory
Sales Trends
New RV sales are down 4.67% year-over-year, that’s a slowdown, though less severe than prior declines (which were > 8%).
The decline is concentrated in the motorized category, which is down about 10.5% y/y, while towables are down 4%.
On the used side, sales are actually up 1% (modestly) and online search-traffic (“travel trailers near me,” etc.) is up 14% y/y, signaling more people are interested in purchasing an RV.
Supply is rising, dealer inventory is up about 16%, meaning available stock is outpacing demand growth.
What the broader data says
The RV Industry Association (RVIA) via its “RV RoadSigns” forecast suggests 2025 shipments of 320,400–353,500 units and 2026 at 332,400–366,100 units. RVIA
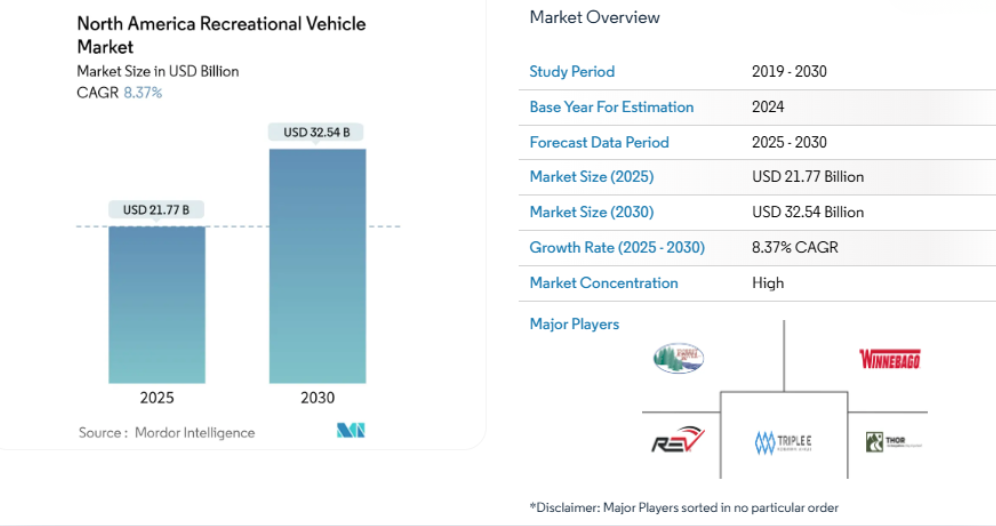
Global forecasts expect the RV market to grow (albeit slowly) across the decade. For example: the global market size was USD 48.26 billion in 2023 and projected to reach USD 69.23 billion by 2032 (CAGR 4.2%). Fortune Business Insights
For North America, forecasts point to stronger growth in some segments: e.g., used RVs rising at 7.28% CAGR from 2025-2030. Mordor Intelligence+1
Though the market is not skyrocketing, it’s also not collapsing — what we’re seeing is a stabilization with caution. Some segments (especially motorized RVs) have been hit harder than others; towables are holding up relatively better. Rising inventory combined with softer demand means price pressure and more selective buyers.
Segment Deep-Dive: Towables vs Motorized & New vs Used
Towables vs Motorized
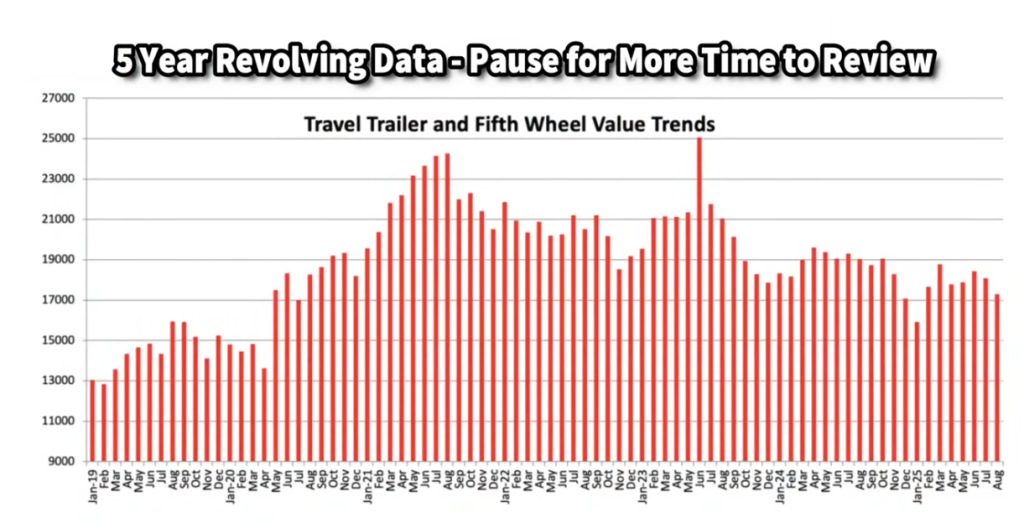
Towables (travel trailers, fifth wheels, pop-ups) are down 4% y/y. According to volume, this means they are driving much of the “less bad” result.
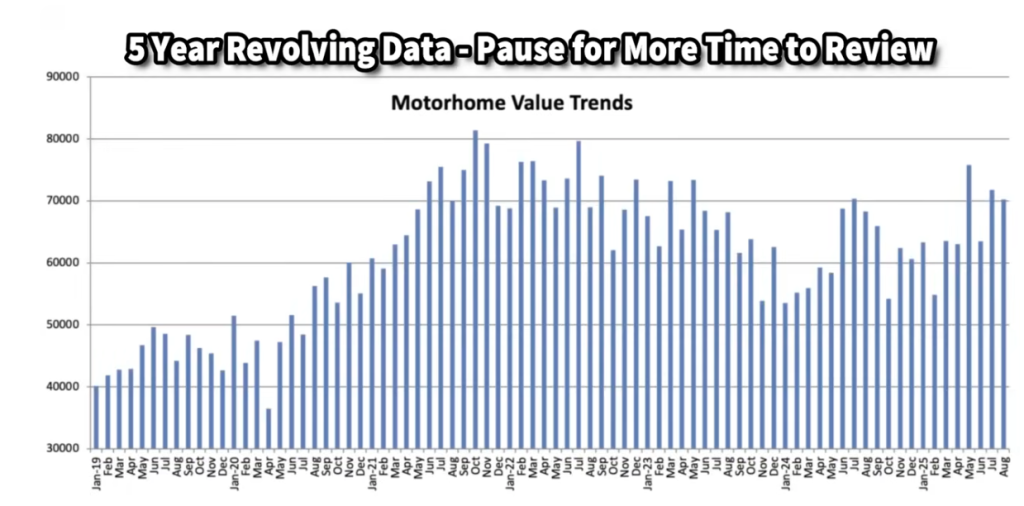
Motorized (Class A, B, C, etc.) is down 10.5% y/y, impacting the overall average more than the numbers alone might suggest.
The reduced decline in towables may reflect affordability, easier financing, simpler ownership.
New vs Used
New RVs: Slowing sales, higher inventories, and production still somewhat high from pandemic-era momentum.
Used RVs: Slight upward movement in sales (1%) and strong indicator behavior (searches up 14%). Used values for towables are softening, particularly as hold-over units from last year enter the market.
Josh notes a classic scenario: the 2026 model year units are appearing, meaning some 2025 “hold-over” units are being discounted — these are potential deals for buyers who will accept less than “brand new” features.
What this means for buyers/sellers
For buyers
Opportunity: Used RV values are lower than the pandemic highs and dealer inventory is higher which means negotiation leverage.
Pro/con: If you buy a unit now (especially in fall/shoulder-season), so while you may get a better deal, your usage time may be limited before winter, and you will want to consider costs like storage and insurance.
External Influences: Fuel, Public Lands & Consumer Behavior
Fuel Prices
Josh notes that fuel prices have stayed “very quiet” this year and have slightly declined entering shoulder season, likely because fewer road trips are being taken and demand is down.
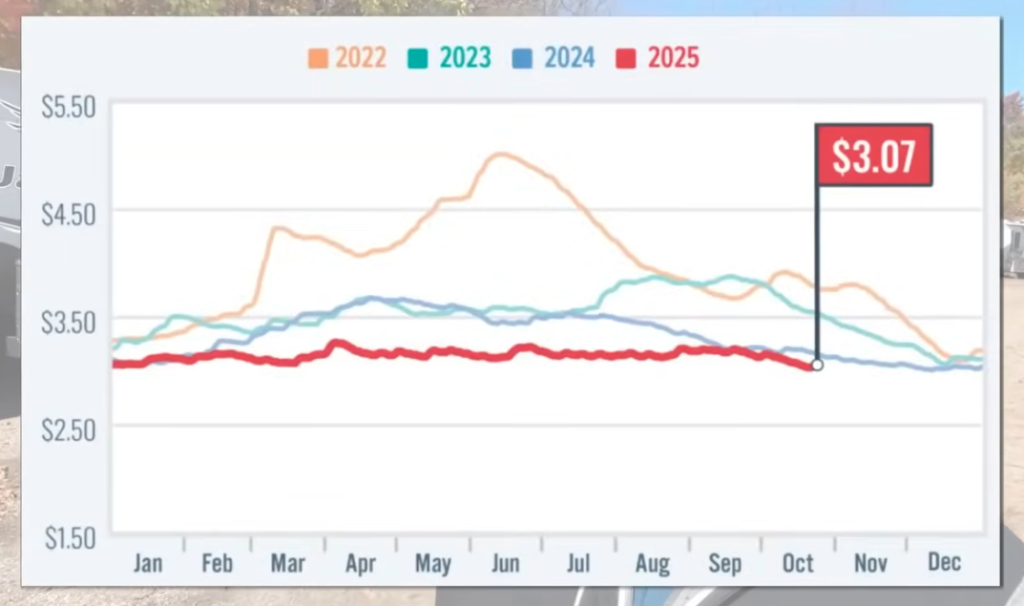
For RV buyers: lower fuel costs reduce one barrier to usage, but the broader impact is modest relative to other cost factors (insurance, storage, interest).
Public Land / Government Shutdown Risk
A non-traditional but important factor with the government shutdown affecting agencies like National Park Service or Bureau of Land Management, access to restrooms, services, staff, or campgrounds may be limited. Plan bathrooms being unavailable!
That has implication for trip planning, especially for full-time RVers or remote destination buyers.
Full‐time RVing Trend
Josh highlights that the number of people living full-time in RVs is approximately half a million, and has more than doubled since 2021.
He raises the caution that many RVs aren’t built for 365-day occupancy and greater wear & service burden may follow.
Even though full-timing is a small slice today, it may become a bigger one — affecting used-market supply and service infrastructure demand.
Technology & Product Innovation Signals
Smart/RV connected features & data security
Increase in “smart home” type features in RVs (connected appliances, listening devices) means rising concerns around data security, privacy, firmware updates.
Independent research found some manufacturers invest more in data protection than others This is a trend worth watching for premium buyers.
Component innovations
A combo tankless water heater + furnace unit (Suburban RV1) for small trailers. This type of simplification is attractive for space-efficient towables.
Air-conditioning: Variable-output compressors (e.g., Coleman IntelAir vs Furion Chill Cube) are breaking long-standing tech stagnation in RVs.
Electrification: The pull-back of General Motors’s chassis for electric RVs signals that fully electrified RVing is still a long way off.
According to Mordor Intelligence, battery-electric RVs are expected to grow at 20-23% CAGR, but from a small base. Mordor Intelligence+1
On the Question: “Is the RV Market Tanking?”
Top expert, Josh the RV Nerd: No, it’s NOT collapsing. However, it is facing headwinds, and we’re seeing a transition phase rather than booming growth.
Here’s a quick table:
| Indicator | Status | Implication |
|---|---|---|
| New RV sales | Down 4.7% | Soft purchaser demand; dealers must manage expectations |
| Motorized segment | Down 10.5% | More risk in high-ticket motorhomes; towables safer bet |
| Inventory supply | Up 16% | Dealer lots may have more units than buyers; margin pressure |
| Used RV market | Slightly up in volume; values softening | Opportunity for buyers; caution for sellers/traders |
| Consumer interest (searches) | Up 14% | Good signal for “future buyers in the funnel” |
| External cost factors (fuel, interest) | Mixed but moderate | Fuel stable, but interest rates and economic uncertainty still drag |
| Innovation/tech | Emerging but early | Differentiation opportunity for newer models |
In short, the market is re-balancing. For smart buyers and dealers who adapt to this environment, there are opportunities.
What to Watch Next (Fall 2025 & Into 2026)
As we move into 2026, the RV industry is set for a period of steady recalibration rather than rapid growth. Buyers should watch interest rates, inventory turnover, and used RV values.
The open road ahead may look different — but for those who adapt, it’s still full of opportunity and adventure!
Interest Rates & Financing — High finance costs can dampen buyer demand, especially for larger motorized units.
Dealer Inventory Turnover — If holding times stretch, discounting will deepen and margins will compress.
Used RV Values — Watch for stabilization or uptick; if new RV prices creep up, used may follow.

Full-time RVing Growth — If the “living in RV” trend accelerates, we may see changes in product specs, service infrastructure, and resale pools.
Electric/Hybrid Adoption — Although still nascent, early movers will gain mindshare; infrastructure (charging, awnings, solar) will matter.
Public Lands and Outdoor Access — Any policy or shutdown issues (campground access, federal land services) could impact usage and buyer sentiment.
Seasonal Usage Patterns — With fall/shoulder season here, marketing towards off-peak trips and storage preparation is key.
Final Thoughts
The RV market isn’t crashing—it’s correcting. For buyers, that correction means opportunity.
With more inventory, softer prices, and plenty of quality used units available, this is one of the most flexible markets we’ve seen in years.
Whether you’re a first-time buyer or trading up, patience and research can pay off big right now. Look for value, ask smart questions, and work with a trusted dealer who helps you find the right fit—not just the newest model.
Written By: Brooke Erickson
Some say I am a writer, I like to say I am a storyteller